A terrain flood-exposure screen over the valley — the low ground monsoon runoff collects toward, read from a 30 m elevation model.
The finding
Reading the 30-metre Copernicus elevation model across Kathmandu Valley, Nepal, 3.8% of the area sits in the bottom fifth of the local height range — the ground toward which surface water runs. The land spans 934 m to 2,552 m, a relief of 1,618 m.
Only 3.8% of the area is low-lying — most of it drains toward lower ground elsewhere.
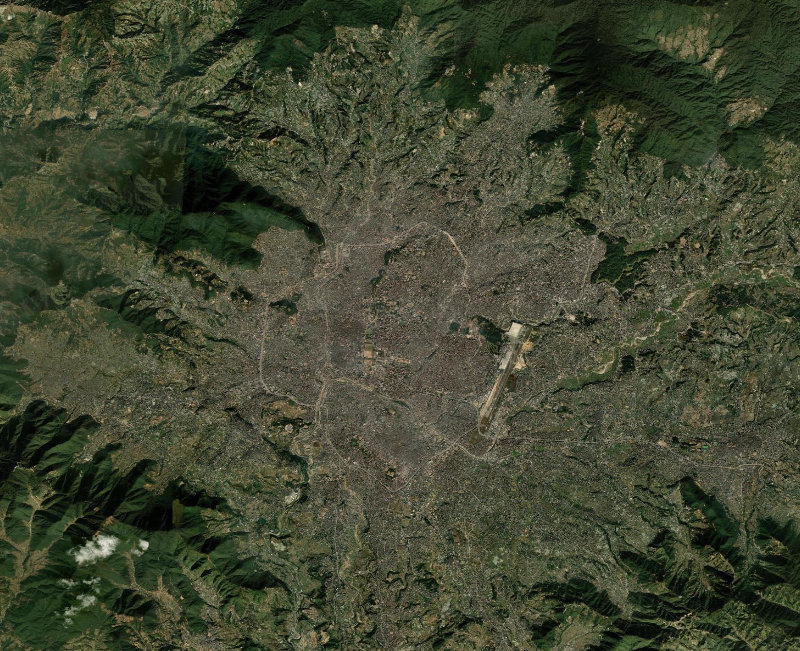

In a monsoon city the low fifth is where water pools first and drains last. Mapping it before the rain — rather than after the flood — is the difference between a managed drain and a submerged street, and it costs nothing but a read of the elevation model.
Why the low ground matters
Water does one thing reliably: it moves downhill and stops at the lowest point it can reach. That makes the elevation surface a first-order map of flood exposure, independent of any single storm. A neighbourhood in the low fifth is not doomed to flood, but it is the neighbourhood where a blocked culvert or an intense cloudburst will show up first.
Read this alongside surface-water history and land cover for the same area, and a fuller picture emerges: where water used to sit, where the ground would send it now, and what has since been built on top.
3.8% of the area sits on low ground.measured over Kathmandu Valley, Nepal · public satellite data
How to read a flood-exposure screen
Elevation is the most stubborn fact about a place. Roads move, buildings rise and fall, but the shape of the ground changes only over geological time — and water obeys that shape without exception. A flood-exposure screen ranks every pixel by where it sits in the local height range and flags the lowest fifth, because that is the ground water reaches first and leaves last.
The number to watch is the share of the area in that low band, read against the relief. A large low-lying share in a landscape with real relief describes a genuine basin — a bowl that collects runoff. The same share across nearly flat ground means something weaker, because when everywhere is low, "lowest" loses its meaning; the screen says so rather than pretending otherwise.
Used well, this is a planning instrument, not a forecast. It tells you which streets to check the drains on before the monsoon, which plots deserve a second look before they are built on, and where a cloudburst will reveal a drainage problem you already had. It cannot tell you it will flood on Tuesday — nothing that reads only the ground can — but it can tell you where to look first when it does.
Why mapping the low ground matters
Urban flooding is rarely a surprise to the ground — only to the people on it. The low-lying map exists because the cheapest flood defence is knowing, in advance and in detail, where water will go. That knowledge changes decisions: which drains to clear first, which plots to think twice about before building, where to put a retention pond so it does the most good.
As rainfall grows more intense in a warming climate, the margin for guessing narrows. A terrain screen will not tell you when the next cloudburst lands, but it will tell you where the water from it collects — and that is the half of the problem that does not change from storm to storm, the half worth solving once and keeping.
Reading this alongside the other layers
A flood-exposure screen is at its most powerful in company. Pair it with a surface-water history and you can see where water used to sit versus where the ground would send it now; add a land-cover read and you learn what has since been built across those low corridors. The terrain says where the water goes; the other layers say what is in its way.
Where these numbers come from
Every figure on this page is measured, not guessed. We read it straight from Copernicus DEM GLO-30 — the same public satellite record that scientists and government agencies rely on — across the exact area shown on the map, counting 584,749 individual pixels of ground.
Because the source is a fixed, published dataset and the study area is a fixed boundary, the reading is fully reproducible: open the same place in the Dyaan workspace and you will get the same numbers, to the hectare. Where the data can answer a question, we give you the figure. Where it cannot, we say so plainly rather than reach for something that merely looks authoritative.
What this analysis is — and what it is not
A flood-exposure screen reads bare-earth elevation only. It knows nothing about drains, culverts, soil infiltration, river levels or how hard it actually rains, so it flags the ground where water would collect — a screening signal, not a hydrological flood forecast.
Dyaan’s design rule is to state that footprint plainly rather than paper over it. A number here is only ever as good as the sensor and the method behind it, and both are named. Where the data cannot answer a question, the honest answer is that it cannot — and the tool will say so rather than fill the gap with something that merely looks authoritative.
Reproduce this yourself in about a minute
Every figure above is checkable, and checking it is the fastest way to trust it:
- Open the Dyaan workspace and sign in (the free tier is enough for this).
- Search for Kathmandu Valley, Nepal, or draw a rectangle over the same area on the map.
- Choose the Flood exposure analysis from the panel and press Run.
- Read the headline numbers, open the table for the full breakdown, and export a CSV or PDF if you want to keep it.
You are not limited to the places Dyaan writes about. The same engine runs over any lake, city, forest or coastline on Earth — so if there is a place you actually care about, that is the one to point it at.
A short glossary
- Relief — the height difference between the highest and lowest ground in the area.
- Low-lying — ground sitting in the bottom fifth of the local height range, where surface water tends to collect.
- DEM — digital elevation model — a grid of ground-surface heights, here at 30 m spacing.
- Hectare — 10,000 square metres.
The bottom line
This is an original Dyaan field note — the words, the framing and the pictures are ours; the only thing borrowed is the public dataset behind it, Copernicus DEM GLO-30, which is an input rather than an article. Nothing here is lifted from another publication, and every number can be checked in the tool.
If a place matters to you — a lake near your home, a forest you grew up beside, a valley that floods every year — you do not have to wait for Dyaan to write about it. Point the tool at it yourself and read the record for that exact ground. Open the workspace → · How every number is measured →