Hansen tree-cover loss in Rondônia, year by year, counted at 30 m from the public record.
The finding
Over 2001–2023, the Hansen Global Forest Change record counts 49,127 hectares of tree-cover loss across Rondônia, Brazil.
The single worst year was 2005, when 5,935 hectares were cleared — the kind of spike that usually marks a front of active clearing rather than gradual thinning.
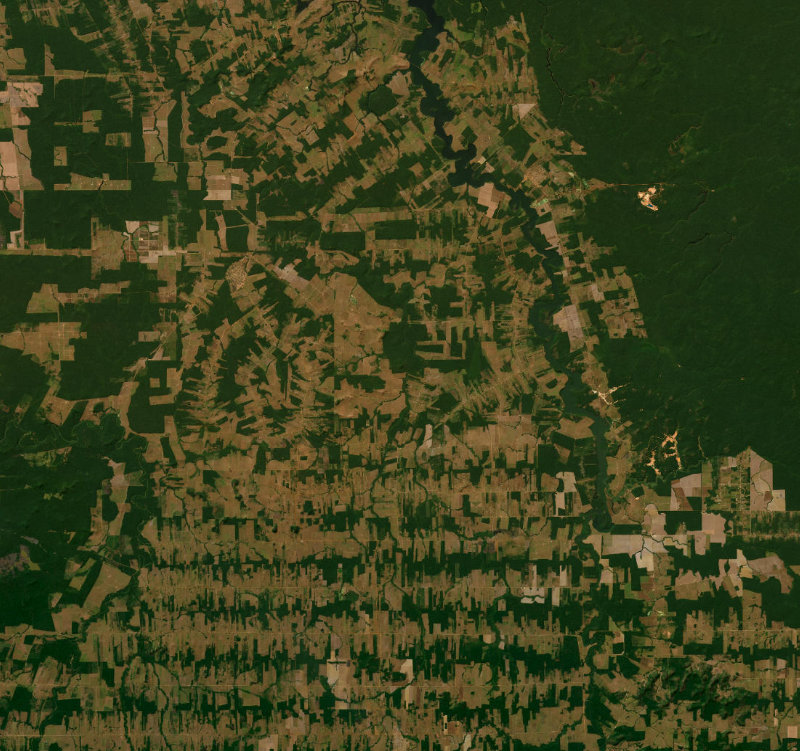
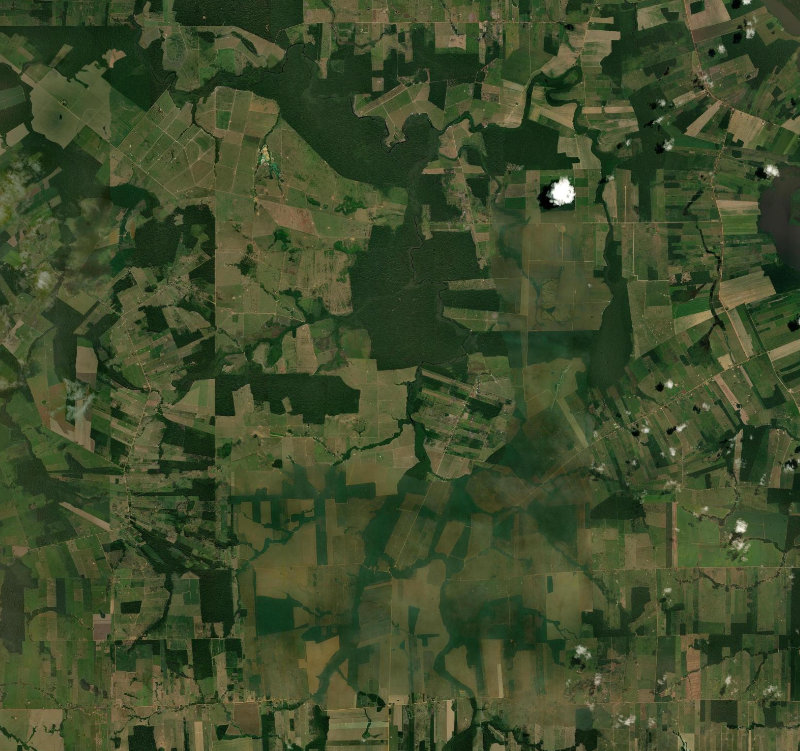
Each hectare is counted from 30-metre pixels flagged as loss in a specific year, which is why the year-by-year shape is a genuine record of when the forest went — not a smoothed trend line drawn after the fact.
Reading a loss record
Forest loss rarely happens evenly. It arrives in pulses — a new road, a dry year, a policy change — and the annual breakdown is where those pulses become visible. A steady drip and a single catastrophic year can add up to the same total while telling completely different stories, and only the yearly figures can tell them apart.
49,127 ha of tree cover lost since 2001.measured over Rondônia, Brazil · public satellite data
How to read a forest-loss record
A total is a blunt instrument. The revealing quantity is the shape of loss over time, because forests are cleared in pulses, not at a constant drip. A new road opens a frontier; a dry year makes fire cheap; a policy loosens and a wave of clearing follows. The annual breakdown is where those forces leave fingerprints, and two areas with identical totals can hide completely different histories underneath.
It also pays to read loss against the forest that existed to begin with. Ten thousand hectares lost from a vast intact block is a wound; the same figure from a small remnant is closer to an amputation. That is why the analysis reports loss as a share of the forest standing at the start, not just as a raw number — the denominator decides how alarming the numerator really is.
Why counting forest loss matters
Forests are carbon stores, water regulators and homes all at once, and their removal is one of the few land changes visible from orbit almost as it happens. Counting it turns an abstraction into an accounting: not "the forest is under pressure" but this many hectares, in these years, on this frontier.
That precision is what makes the record useful to anyone who has to act — a ranger, a regulator, a supply-chain auditor. A trend you can measure is a trend you can respond to; a loss you only sense is a loss you argue about until it is complete.
Reading this alongside the other layers
Forest loss rarely travels alone. Read it beside a land-cover snapshot to see what replaced the trees — pasture, cropland, bare ground — and beside a surface-water read to catch the new reservoirs and the silted rivers that so often follow a clearing front. One layer names the loss; the others name its consequences.
Where these numbers come from
Every figure on this page is measured, not guessed. We read it straight from Hansen GFC GFC-2023-v1.11 — tree-cover loss (Hansen et al., Science 2013) — the same public satellite record that scientists and government agencies rely on — across the exact area shown on the map, counting 1,081,000 individual pixels of ground.
Because the source is a fixed, published dataset and the study area is a fixed boundary, the reading is fully reproducible: open the same place in the Dyaan workspace and you will get the same numbers, to the hectare. Where the data can answer a question, we give you the figure. Where it cannot, we say so plainly rather than reach for something that merely looks authoritative.
What this analysis is — and what it is not
"Loss" means the removal of tree cover for any reason — logging, fire, clearing or windthrow — and is not the same as permanent deforestation; regrowth is tracked in a separate layer. A single 30 m pixel can also straddle a forest edge.
Dyaan’s design rule is to state that footprint plainly rather than paper over it. A number here is only ever as good as the sensor and the method behind it, and both are named. Where the data cannot answer a question, the honest answer is that it cannot — and the tool will say so rather than fill the gap with something that merely looks authoritative.
Reproduce this yourself in about a minute
Every figure above is checkable, and checking it is the fastest way to trust it:
- Open the Dyaan workspace and sign in (the free tier is enough for this).
- Search for Rondônia, Brazil, or draw a rectangle over the same area on the map.
- Choose the Forest loss analysis from the panel and press Run.
- Read the headline numbers, open the table for the full breakdown, and export a CSV or PDF if you want to keep it.
You are not limited to the places Dyaan writes about. The same engine runs over any lake, city, forest or coastline on Earth — so if there is a place you actually care about, that is the one to point it at.
A short glossary
- Tree-cover loss — a pixel that changed from forest to non-forest in a given year.
- Canopy threshold — the minimum tree-cover density counted as "forest" for this read.
- Hectare — 10,000 square metres.
The bottom line
This is an original Dyaan field note — the words, the framing and the pictures are ours; the only thing borrowed is the public dataset behind it, Hansen GFC GFC-2023-v1.11 — tree-cover loss (Hansen et al., Science 2013), which is an input rather than an article. Nothing here is lifted from another publication, and every number can be checked in the tool.
If a place matters to you — a lake near your home, a forest you grew up beside, a valley that floods every year — you do not have to wait for Dyaan to write about it. Point the tool at it yourself and read the record for that exact ground. Open the workspace → · How every number is measured →