Live thermal detections from NASA FIRMS — refreshed every time this story runs.
The finding
In the most recent 24-hour window, NASA’s VIIRS instruments logged 149 active-fire detections across Northern California, USA, emitting a combined 855 MW of fire radiative power. Dyaan reads these straight from the public FIRMS feed and keeps only the detections inside the area.
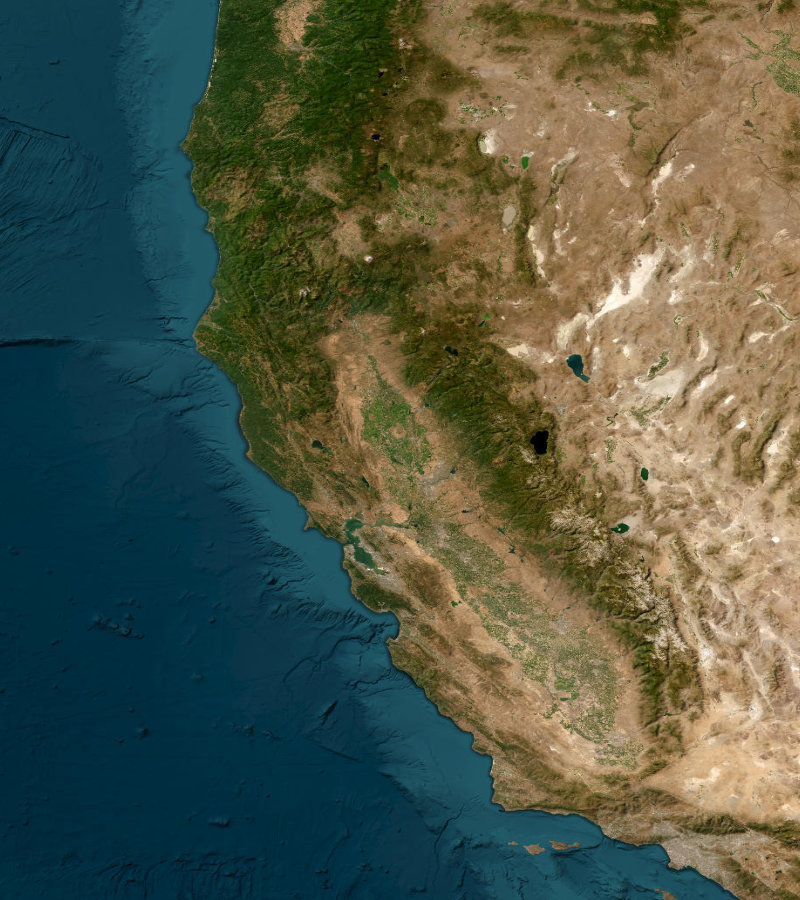
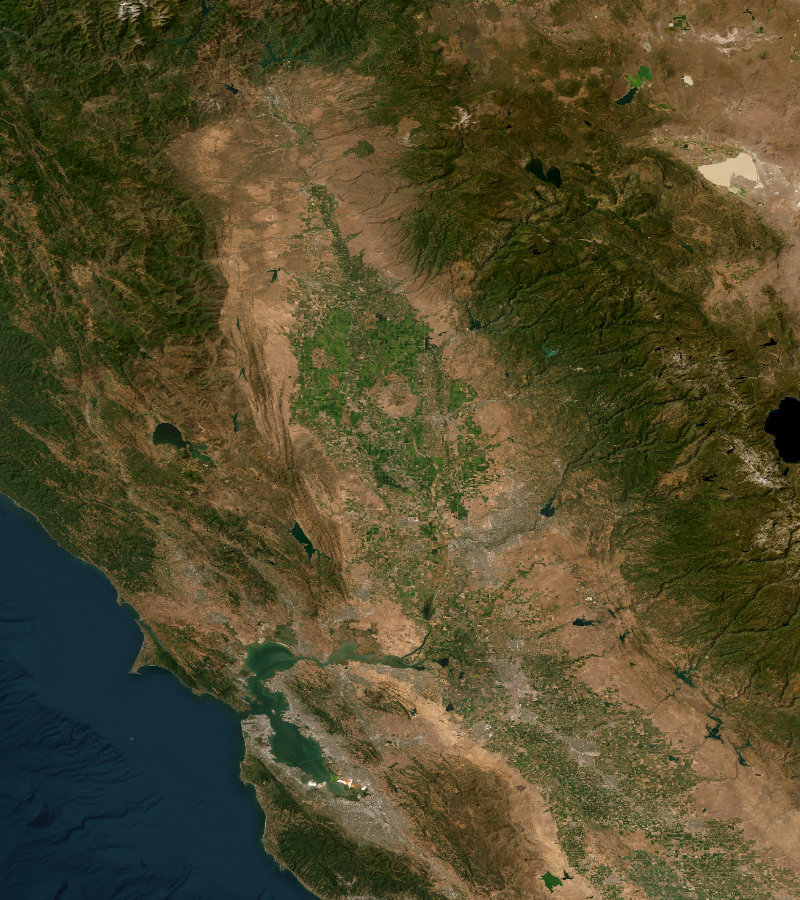
Fire radiative power is a live measure of how much energy the fires are releasing right now — the higher it climbs, the more intense the burning. Because this story re-runs on a schedule, the figure above is as fresh as the last satellite pass over the area.
What a detection does and does not mean
A detection is a pixel hot enough to stand out from its surroundings. That is a strong signal, but it is not a headcount of wildfires: a single large fire can light up many pixels, and industrial heat or agricultural burning can light up a few. The value of the feed is its speed and its coverage — it sees everywhere, every day — not its ability to name a fire.
149 active fire detections in the last 24 h.measured over Northern California, USA · public satellite data
How to read a live fire feed
A thermal feed trades certainty for speed. It cannot confirm a wildfire the way a firefighter on the ground can, but it sees the entire region every day, in daylight and dark, and it never looks away. That makes it superb for one job in particular: noticing that something has changed. A jump in detections or a surge in radiative power is a prompt to look closer, not a verdict on its own.
Read the two numbers together. Detections count how many hot pixels the satellite saw; fire radiative power measures how fiercely they are burning. A handful of intense detections and a scatter of weak ones tell very different stories, and only the pair distinguishes a serious fire front from routine background heat.
Why a live fire feed matters
When a fire is moving, hours matter, and a feed that refreshes with every satellite pass buys some of those hours back. It will not replace ground truth, but it flags the places that deserve a closer look before the smoke is visible from a road.
Across a season, the same feed becomes a map of where and when fire tends to arrive — the kind of pattern that informs where to pre-position people and what to watch as conditions dry out.
Reading this alongside the other layers
A fire feed gains meaning from context. Overlay it on a land-cover read to separate forest fire from crop burning, and check a vegetation layer to see how dry the fuel was going in. The detection says where the heat is; the other layers say what is burning and why it caught.
Where these numbers come from
Every figure on this page is measured, not guessed. We read it straight from NASA FIRMS VIIRS 375 m active fire, last 24 h (NRT, C2) — the same public satellite record that scientists and government agencies rely on — across the exact area shown on the map.
Because the source is a fixed, published dataset and the study area is a fixed boundary, the reading is fully reproducible: open the same place in the Dyaan workspace and you will get the same numbers, to the hectare. Where the data can answer a question, we give you the figure. Where it cannot, we say so plainly rather than reach for something that merely looks authoritative.
What this analysis is — and what it is not
A thermal detection is an anomaly hot enough to register from orbit, not a confirmed wildfire: gas flares, furnaces and agricultural burning all show up. Near-real-time detections are provisional and may be revised by NASA, and cloud can hide a fire from the satellite entirely.
Dyaan’s design rule is to state that footprint plainly rather than paper over it. A number here is only ever as good as the sensor and the method behind it, and both are named. Where the data cannot answer a question, the honest answer is that it cannot — and the tool will say so rather than fill the gap with something that merely looks authoritative.
Reproduce this yourself in about a minute
Every figure above is checkable, and checking it is the fastest way to trust it:
- Open the Dyaan workspace and sign in (the free tier is enough for this).
- Search for Northern California, USA, or draw a rectangle over the same area on the map.
- Choose the Wildfire analysis from the panel and press Run.
- Read the headline numbers, open the table for the full breakdown, and export a CSV or PDF if you want to keep it.
You are not limited to the places Dyaan writes about. The same engine runs over any lake, city, forest or coastline on Earth — so if there is a place you actually care about, that is the one to point it at.
A short glossary
- Detection — a single pixel flagged as anomalously hot by the satellite in one overpass.
- Fire radiative power (FRP) — the rate of energy a fire is emitting, in megawatts — a live proxy for intensity.
- VIIRS — the 375 m thermal instrument aboard the Suomi-NPP and NOAA-20 satellites.
The bottom line
This is an original Dyaan field note — the words, the framing and the pictures are ours; the only thing borrowed is the public dataset behind it, NASA FIRMS VIIRS 375 m active fire, last 24 h (NRT, C2), which is an input rather than an article. Nothing here is lifted from another publication, and every number can be checked in the tool.
If a place matters to you — a lake near your home, a forest you grew up beside, a valley that floods every year — you do not have to wait for Dyaan to write about it. Point the tool at it yourself and read the record for that exact ground. Open the workspace → · How every number is measured →